This website uses cookies so that we can provide you with the best user experience possible. Cookie information is stored in your browser and performs functions such as recognising you when you return to our website and helping our team to understand which sections of the website you find most interesting and useful.
Fondaway Canyon
Fondaway Canyon is an advanced stage gold property located in the Churchill County, Nevada. The land package contains 170 unpatented lode claims. The property has a history of previous surface exploration and mining in the late 1980’s and early 1990’s. Getchell Gold Corp. (Getchell) signed the Definitive Option Agreement with Canarc Resource Corp. on January 3, 2020 to acquire 100% of the Fondaway Canyon and Dixie Comstock properties.
2022 Highlights
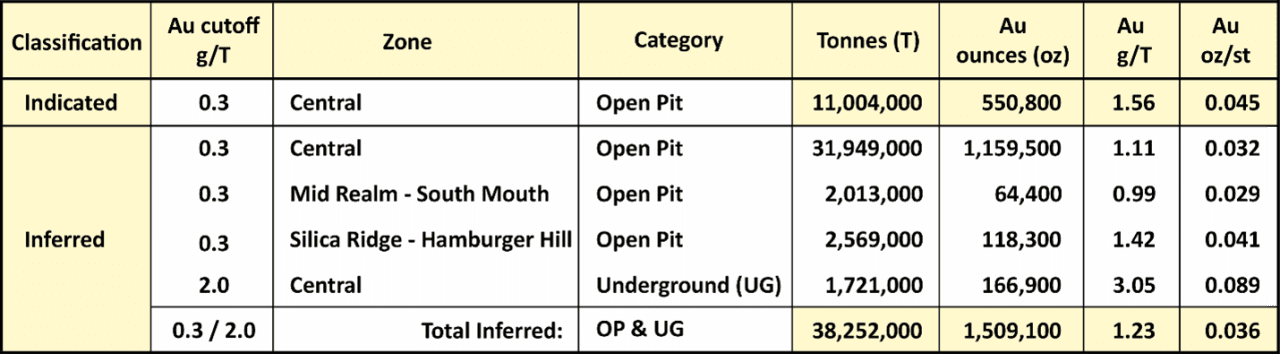
The first Mineral Resources Estimate (MRE) for Fondaway Canyon was released on Dec 15, 2022. The report conceptualizes both potential open pit and underground mining.
The complete Technical Report was published Feb 1, 2023, and is available here : Fondaway Canyon Technical Report
Mineral Resources Estimate Key Highlights
- Significantly expands upon historical mineral resource;
- Indicated Mineral Resource of 11.0 million tonnes at an average grade of 1.56 grams per tonne (g/t) gold (Au) for 550,800 ounces of gold; and
- Inferred Mineral Resource of 38.3 million tonnes at an average grade of 1.23 g/t Au for an additional 1,509,100 ounces of gold;
- Gold mineralization remains open for further expansion in all contributing zones

2022 Fondaway Canyon Drill Program Update (to Dec 1, 2022)
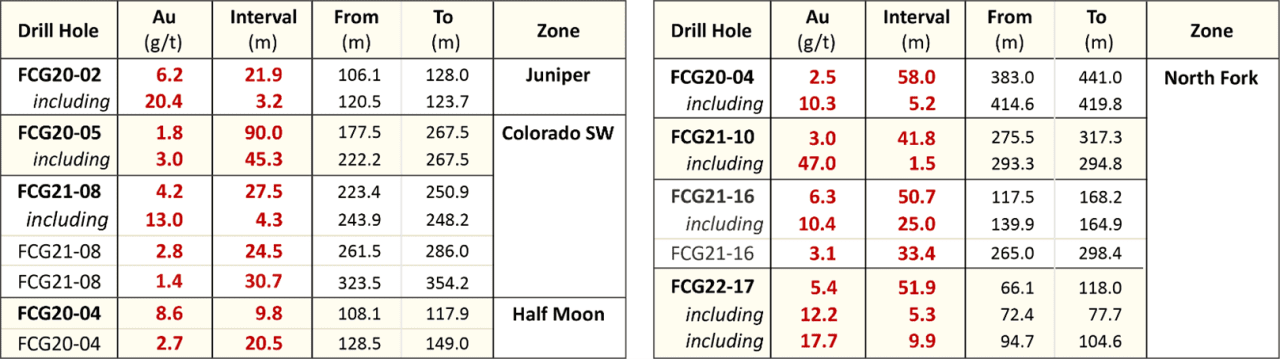
In 2022, Getchell Gold Corp. conducted our most aggressive drill season of the first three years of exploration at Fondaway Canyon. We posted significant news in 2022, starting with the release of the results from the last hole of the 2021 drill program at Fondaway Canyon, FCG21-16, targeting the North Fork zone (Company news release dated February 15, 2022). FCG21-16 encountered a gold interval grading 6.3 g/t Au over 50.7m that includes a higher-grade core returning 10.4 g/t Au over 25.0m and represents the greatest ‘gold grade x thickness’ value in the 40+ year history of gold exploration and mining at the Project.
The 2022 Fondaway Canyon drill season started in early May, and included twelve holes being completed (FCG22-17 to FCG22-28) during the 2022 drill program totaling over 4,500 metres. All assay results from the 2022 campaign have been released.
Drill Hole Intercept Highlights of the 2022 Fondaway Canyon Drill Program
FCG22-28 0.8 g/t Au over 98.0 m and 1.3 g/t Au over 58.0 m (January 18, 2023 news release)
FCG22-26 1.8 g/t Au over 29.4 m and 1.1 g/t Au over 83.8 m; (January 18, 2023 news release)
FCG22-25 3.4 g/t Au over 31.4 m and 1.3 g/t Au over 17.4 m (January 10, 2023 news release)
FCG22-23 3.4 g/t Au over 44.6 m and 1.8 g/t Au over 12.8 m (January 10, 2023 news release)
FCG22-22 8.8 g/t Au over 8.1 m within a broader 3.0 g/t Au over 56.6 m interval, and 2.4 g/t Au over 21.7 m; (November 15, 2023)
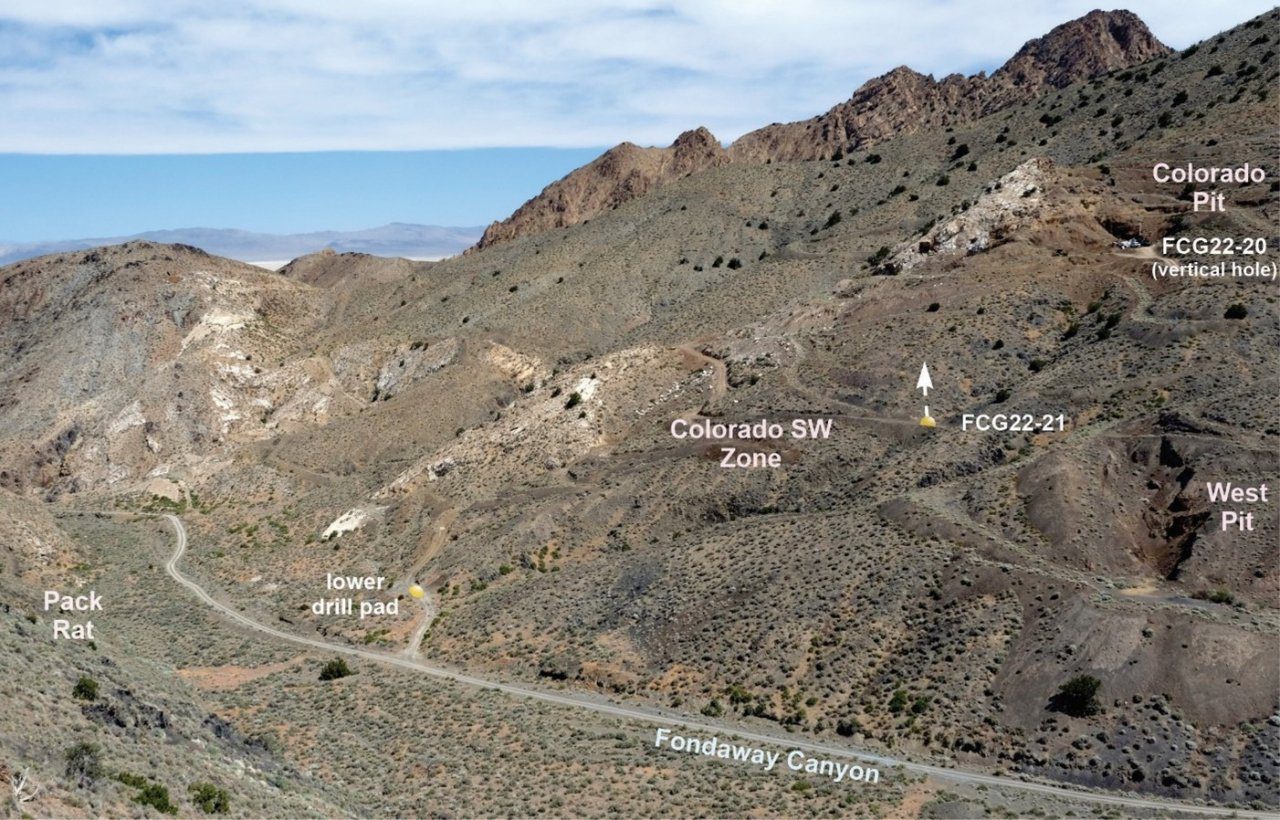
FCG22-21: 0.9 g/t Au over 74.3 m extends Colorado SW zone 50 metres along strike
FCG22-20 Mineralization starting from surface including 1.7 g/t Au over 56.6 m extending Colorado SW 35 metres up-dip (Nov 2, 2023 release)
FCG22-19: 1.8 g/t Au over 107.5 m (Sept. 27, 2022 news release).
FCG22-18: 2.5 g/t Au over 43.4 m, 2.1 g/t Au over 46.9 m, and 1.9 g/t Au over 72.6 m (August 17, 2022 news release)
FCG22-17: 3.8 g/t Au over 85.9 m including 17.7 g/t Au over 9.9 m (July 26, 2022 news release);
The Company’s first Mineral Resources Estimate for the Fondaway Canyon Gold project was released Dec 15, 2022, and included results up to, and including, hole FCG22-19.
Holes FCG22-17, 18, 19, 22, 23, and 25 were designed as step outs to test the extent of the North Fork mineralization encountered in hole FCG21-16 that graded 6.3 g/t Au over 50.7 m. Holes FCG 22, 23, and 25 were additionally designed as step outs to test the extent of the lower North Fork gold zone discovered in FCG22-18 that graded 1.9 g/t Au over 72.6 m.
Hole FCG22-24 was designed to test the Pediment target area located 2 km to the west of the Central Area. The Pediment target area is the westernmost known gold mineralized occurrence along the 3.5 km long E-W trending Fondaway Canyon gold mineralization corridor. The Pediment target area is the site of two vertical drill holes completed in 2022, 02FC-10 and 02FC-11, collared 185 metres apart that intersected 27.4 m grading 0.82 g/t Au and 36.6 m grading 0.52 g/t Au, respectively. FCG22-24 successfully drilled through the Range front Fault and tested the target zone on the footwall side of this structure with results pending. Upon completion of FCG22-24, the drill rig was demobilized from site leaving one rig to continue delineating the mineralization at Fondaway Canyon in the Central Area.
FCG22-26 and 27, stationed near the canyon floor on the same pad as FCG21-12 and 15, were respectively designed to test the eastern extent and conduct infill drilling of the Colorado SW zone.
FCG22-28 is stationed midway up the north slope and is designed to conduct infill drilling and test the down-dip extent of the Colorado SW zone.
On June 23, 2022, Getchell Gold announced that it has engaged Apex GeoSciences to conduct a resources estimate for Fondaway Canyon, to include 2017 drill results from a previous operator, plus full 2020 and 2021 Getchell Gold drill results, and spring/summer 2022 drill results. The Mineral Resources Estimate was released December 2022, and full report was published in February 2023.
“We have been and continue to be extremely successful in our drill programs and look forward to formally quantifying the mineralization defined to date.” states Mike Sieb, President, Getchell Gold Corp. “I expect this is only the first such exercise as we continue to expand and delineate the extensive gold mineralizing system so readily evident at Fondaway Canyon.”
This chart highlights some of the top results from the 2020, 2021, and first hole of 2022 exploration at Fondaway Canyon:
Key Highlights of 2021 Drill Program
Drill Hole FCG21-16 – North Fork Zone
- The highest ‘grade x thickness’ concentration of gold in the 40+ year history of the Fondaway Canyon gold project was encountered;
- High-grade gold mineralization of 10.4 g/t Au over 25.0m within a broader zone grading 6.3 g/t Au over 50.7m was intersected;
- Additional significant gold intervals were intersected including 3.1 g/t Au over 33.4m, a previously unknown lower zone of gold, and 2.1 g/t Au over 14.1m, a newly modelled near surface lens.
Drill Hole FCG21-15- Colorado SW Zone
- Hole FCG21-15 intersected multiple significant gold intercepts within the Colorado SW zone over an 87 metre down hole distance including 1.2 g/t Au over 33.6m; 1.9 g/t Au over 26.4m and 1.6 g/t Au over 7.7m;
- In addition, FCG21-15 also reported 3.3 g/t Au over 10.6m including 17.6 g/t Au over 1.6m, well above the Colorado SW zone and 1.5 g/t Au over 12.6m below the Colorado SW zone;
Drill Hole FCG21-14- Colorado Zone
- FCG21-14 encountered gold mineralization at surface on the Colorado zone grading 2.6 g/t Au over 18.5m including 6.8 g/t Au over 5.4m;
Drill Hole FCG21-13
- Hole FCG21-13 intersected three major gold bearing zones: the ‘at surface’ Colorado, the Juniper, and the Colorado SW gold zones;
- FCG21-13 collared in mineralization on the Colorado zone and proceeded to intersect multiple significant gold intervals within the top 50 metres of the drill hole;
- The high-grade Juniper zone was intersected grading 9.3 g/t Au over 1.9m and 5.7 g/t Au over 11.6m;
- The Colorado SW zone was intersected with multiple intervals spanning a down-hole length of 103.5 metres highlighted by intercepts grading, 1.0 g/t Au over 19.7m, 1.9 g/t Au over 11.8m, and 1.2 g/t Au over 29.1m.
Drill Hole FCG21-12 – Colorado SW Zone
- intersected the Colorado SW zone of gold mineralization over a 92 metre down hole distance that included 6.3 g/t Au over 3.6m, 2.5 g/t Au over 24.5m, and 1.6 g/t Au over 25.5m;
Drill Hole FCG21-11 – Colorado SW Zone
- intersected multiple significant gold intercepts within the Colorado SW zone over a 242 metre down hole distance including 1.4 g/t Au over 14.9m, 1.0 g/t Au over 52.5m and 2.2 g/t Au over 9.1m;
- FCG21-11 also encountered the near surface high-grade Juniper zone grading 8.8 g/t Au over 8.2m;
Drill Hole FCG21-10 Results – North Fork Gold Zone
- Hole FCG21-10 intersected the North Fork Gold Zone mineralization over 82.2m that included the following notable drill intercepts:
- 3.0 g/t Au over 41.6m that included 47.0 g/t Au over 1.5m, the highest-grade gold intercept in the 40+ year drilling history of the Project;
- 4.6 g/t Au over 9.8m; and
- 1.0 g/t Au over 14.3m.
- Hole FCG21-10 intersected North Fork up-dip from FCG20-04 that graded 2.5 g/t Au over 58.0m;
- Hole FCG21-15 targeting the down dip extent of the Colorado SW gold zone is in progress.
“The latest results are a prime example of why the gold mineralizing system at the Fondaway Canyon Gold Project is so compelling. The Project is host to an enviable setting comprised of very high-grade gold bearing structures that are themselves hosted within broader and thicker zones of mineralization. The grades and thicknesses that have become apparent at Fondaway Canyon rival many of our peers in a world class gold district.” states Mike Sieb, President, Getchell Gold Corp.
Drill Hole FCG21-09 Results – North Fork Gold Zone
Drill holes FCG21-09 and 10 targeted the North Fork Gold Zone, respectively above and below the discovery hole drilled in 2020, FCG20-04, that graded 2.5 g/t Au over 58.0m within a broader zone of mineralization.
FCG21-09 was designed to parallel hole FCG21-04, spaced 50 metres above, and to test the down dip extent of the North Fork Zone (Figure 1). Hole FCG21-09 intersected a broad zone of gold mineralization grading 1.2 g/t Au over 32.6m at a higher elevation than projected for the North Fork zone. This zone of mineralization lines up to the west with gold intercepts reported from multiple historic drill holes and likely represents an upper and previously unmodelled gold zone. Additional drilling is planned to determine the extent of this Upper North Fork zone.
FCG21-09 also intersected a number of other notable intercepts, such as 1.3 g/t Au over 13.1m and 4.1 g/t Au over 5.4m. Getchell considers that the hole did not sufficiently penetrate the target zone and these intercepts represent the upper limits of the North Fork gold mineralization. Hole FCG21-10, targeting the North Fork Zone below the FCG20-04 discovery intercept, was designed to provide additional information and assist in the interpretation.
The North Fork gold zone remains open in most directions and warrants significant follow-up.
Drill Hole FCG21-08 Results – Colorado SW Extension Zone
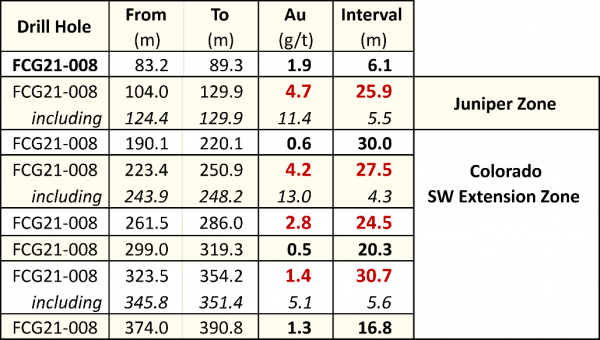
Hole FC21-08 was drilled from the same drill pad as FCG21-07 and was designed to test the Colorado SW Extension Zone down-dip, and to the west, of FCG20-02. The hole produced highly impressive results from the Colorado SW Extension Zone, spanning a distance greater than 200m downhole. The highlighted gold grade intervals are shown in Table 1 and along the drill hole trace in Figure 3. The Colorado SW Zone remains open laterally and to depth.
Four notable and adjacent drill intercepts grade:
- 4.2 g/t Au over 27.5m from 223.4 to 250.9m, including 13.0 g/t Au over 4.3m from 243.9-248.2m;
- 2.8 g/t Au over 24.5m from 261.5 to 286.0m;
- 1.4 g/t Au over 30.7m from 323.5 to 354.2m; and
- 1.3 g/t Au over 16.8m from 374.0 to 390.8m.
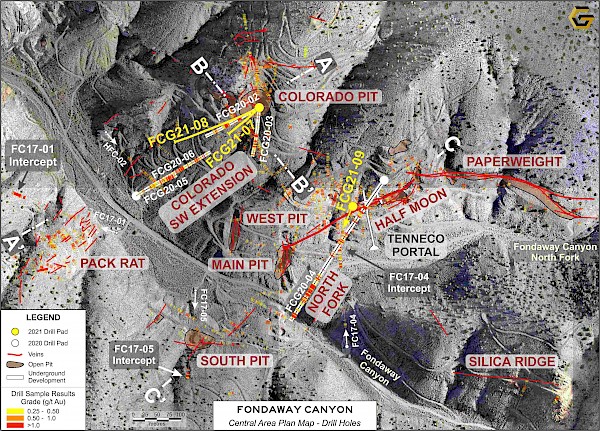
Figure 1: Fondaway Canyon Central Area Plan Map showing 2021 drill hole locations.
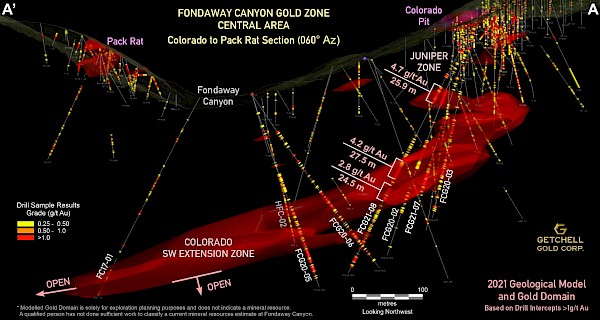
Figure 2: Fondaway Canyon 3D Gold Domain Model – Colorado Pit to Pack Rat (NE-SW) Section*
Hole FCG21-08 was the seventh consecutive hole in the Central Area that has intersected substantive gold mineralization.
“The unfolding story at the Fondaway Gold Project just keeps getting better. We continue to hit significant grades of mineralization over considerable widths, with our latest drill hole reporting one of the most outstanding series of gold intercepts in the forty-five-year history of gold exploration on the Project.” stated Mike Sieb, President, Getchell Gold Corp.
President Mike Sieb has recorded an accompanying video augmenting these results. The narrated video can be viewed here: https://youtu.be/SrEQ7wo3daw
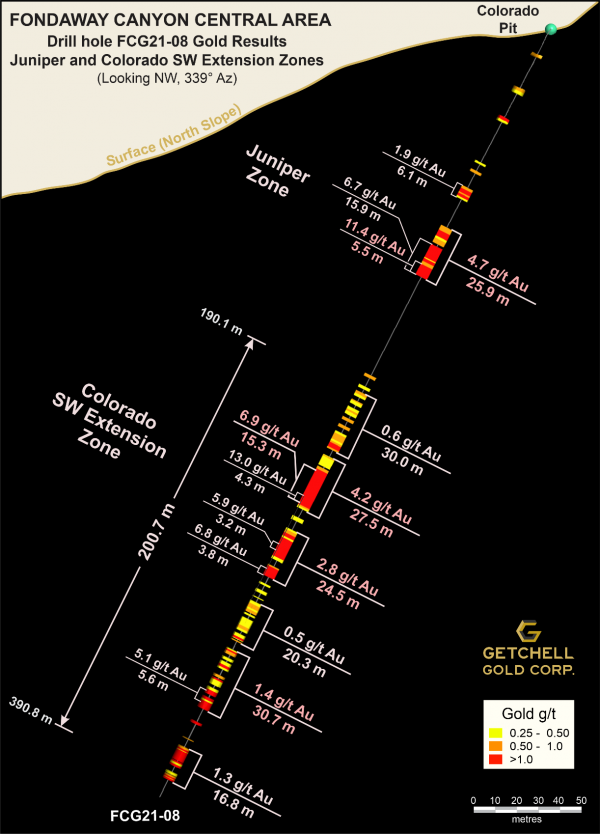
Figure 3: FCG21-08 Drill Hole Trace with Gold Intervals, Looking NW
2021 Drill Program Results – Juniper Zone
Hole FCG21-08 also tested the Juniper Zone, located within 100 metres of surface, with a 10m vertical step out from FCG20-02 (Figure 2). FCG21-08 intersected the Juniper Zone between 104.0-129.9m returning 4.7 g/t Au over 25.9m that included 11.4 g/t Au over 5.5m (Figure 3).
The Juniper Zone was discovered in 2020 by FCG20-02 that intersected 6.2 g/t Au over 21.9m that included 20.4 g/t Au over 3.2 m (Company news release Jan. 27, 2021). The new Juniper zone represents a significant high-grade gold zone proximal to surface, remains open in most directions, and will be followed up by additional drilling.
Table 1: FCG21-08 Gold Grade Interval Highlights
Drill Hole FCG21-07 – Colorado SW Extension Zone
The first drill hole of the 2021 program, FCG21-07 was drilled southwest from the Colorado Pit (Figure 2). Two holes from the 2020 drill program, FCG20-02 and FCG20-03, were drilled from the same pad. The gold intercepts encountered in holes FCG20-02 and FCG20-03, 1.9 g/t Au over 43.5m and 2.0 g/t Au over 49.0m respectively, are 75m apart from each other and FCG21-07 was drilled between these two 2020 gold intercepts to establish the lateral continuity of the Colorado SW Extension zone across this broad distance.
FCG21-07 intersected a higher-grade gold interval than the neighbouring drill holes, grading 3.0 g/t Au over 33.0m of uninterrupted mineralization including an interval grading 7.8 g/t Au over 4.6m. The highlighted gold intervals from hole FCG21-07 and select adjacent holes are shown in Table 1.
Hole FC21-07 represented the sixth consecutive drill hole that has intersected a substantive interval of gold mineralization at the Central Area of Fondaway Canyon. It was also the first hole drilled in 2021 to start tying together the broad and thick zone of gold mineralization, modelled 800m down dip from the Colorado Pit, discovered during the 2020 drill program
Fondaway Canyon 3D Gold Domain Model – Colorado Pit to Pack Rat (NE-SW) Section*
The modelled gold domain highlights areas where gold intervals have been geologically linked and projected. The modelled gold domain is solely for exploration planning purposes and does not indicate a mineral resource. A qualified person has not done sufficient work to classify a current mineral resources estimate at Fondaway Canyon.
Scott Frostad, P.Geo., is the Qualified Person (as defined in NI 43-101) who reviewed and approved the content and scientific and technical information in the news release.
Highlighted drill intervals are based on a 0.25 g/t Au cut-off, minimum interval lengths of 10 feet (3.3 metres), and a maximum of 10 feet of internal dilution, with no top cut applied. All intervals are reported as downhole drill lengths and additional work is required to determine the true width.
The 2020 and 2021 drill core was cut at Bureau Veritas Laboratories’ (“BVL”) facilities in Sparks, Nevada, with the samples analyzed for gold and multi-element analysis in BVL’s Sparks, Nevada and Vancouver, BC laboratories respectively. Gold values were produced by fire assay with an Atomic Absorption finish on a 30-gram sample (BV code FA430) with over limits re-analyzed using method FA530 (30g Fire Assay with gravimetric finish). The multi-element analysis was performed by ICP-MS following aqua regia digestion on a 30g sample (BV code AQ250). Quality control measures in the field included the systematic insertion of standards and blanks.
The 2017 Technical Report commissioned by Canarc and authored by Techbase International Ltd. has a historical estimate of Indicated resources of 409,000 oz. Au contained in 2,050,000 tonnes grading 6.18 g/t and Inferred resources of 660,000 oz. Au contained in 3,200,000 tonnes grading 6.4 g/t, using a 1.8 m width cut-off and a cut-off grade of 3.43 g/t Au.
The Fondaway Canyon mineralization is contained in a series of 12 steeply dipping en-echelon quartz- sulphide shears outcropping at surface and extending laterally over 1,200 m, with drill proven depth extensions to > 400 m. The deposit is hosted by Mesozoic age sediments and minor volcanics and is classified as “orogenic”, ranging from mesothermal to epithermal in depositional environment. Mineralization is hosted within shears, spatially- and temporaneously-related to certain dykes that occupy the shears, but mineralization also permeates into the hosting sediments. Additional exploration targets include near-surface oxide gold along favorable structural and host rock targets and deeper extensions of the sulphide zones. The >2 g/t rock chip and drill intercept results reveal a sizable, internally consistent and well mineralized zone with abundant exploration targets that have the potential to extend and increase the mineralized zones (see figure below).
This historic resource estimate was completed by Techbase International Ltd of Reno, Nevada, and it is contained within a NI 43-101 report dated April 3, 2017 that was commissioned by Canarc Resource Corp of Vancouver, B.C., Canada. The resource estimate was compiled only from drill holes that could be validated (591 holes @ 49,086 m), a sufficient amount to deem the historic resource as reliable. Using Techbase software, a method of polygons was used along each vein. With a minimum 0.10 opt Au and 1.8 m horizontal vein width used as cut-off parameters, twelve veins had sufficient composited intercepts within the sulfide mineralization for the estimate. No capping or cutting of grades was applied. The historical resource estimate used classifications in accordance with NI 43-101 standards, namely, “indicated” and “inferred”. A review and/or recalculation of the historic resource is required by an independent Qualified Person to confirm these as current resources as defined by NI 43-101. A qualified person for Getchell has not done sufficient work to classify the historical estimate as current mineral resources; and the issuer is not treating the historical estimate as current mineral resources
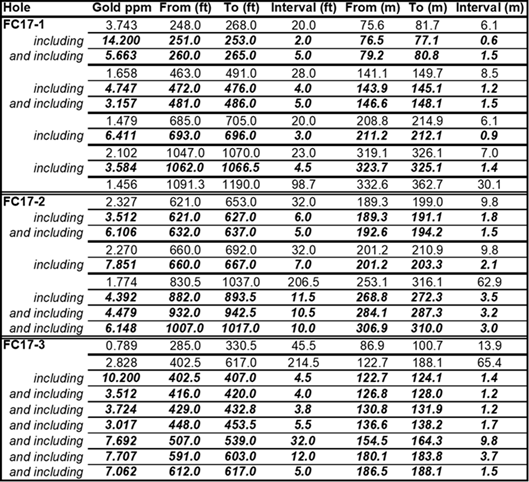
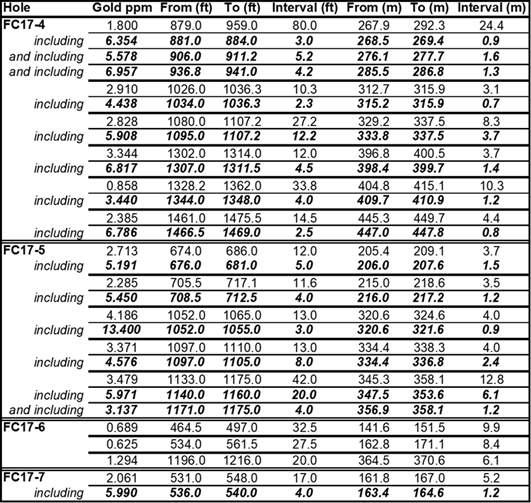
In 2017, Canarc drilled 7 holes in Fondaway Canyon which all intersected multi gram gold mineralization. These holes were not included in the historic resource report.
.